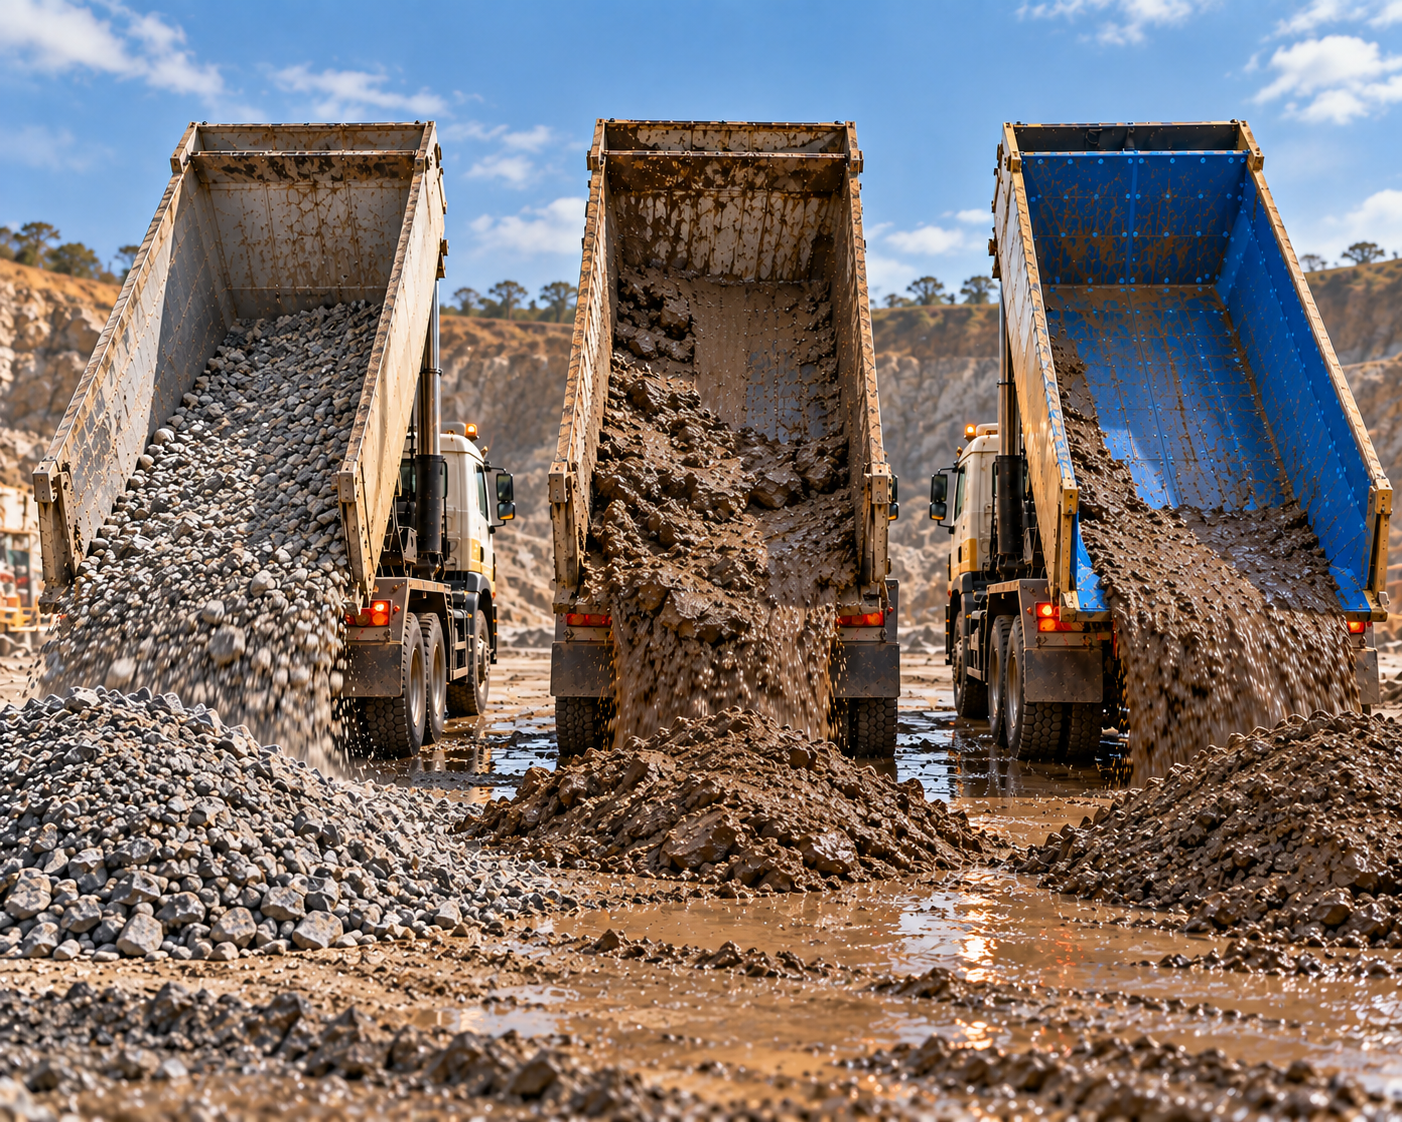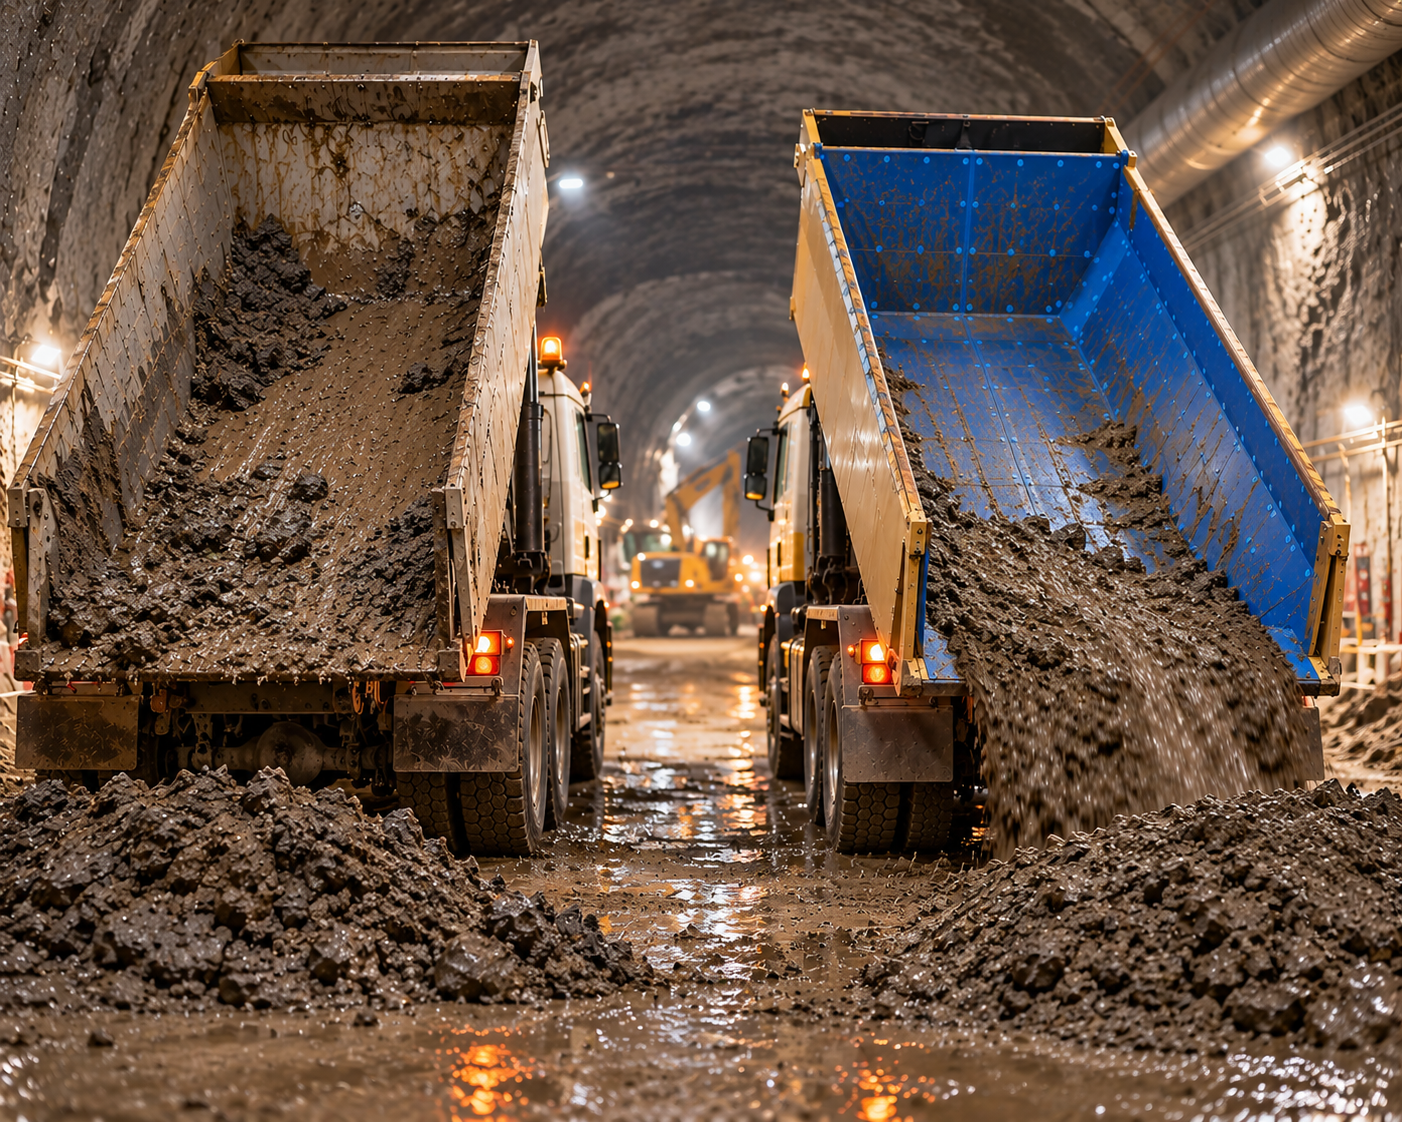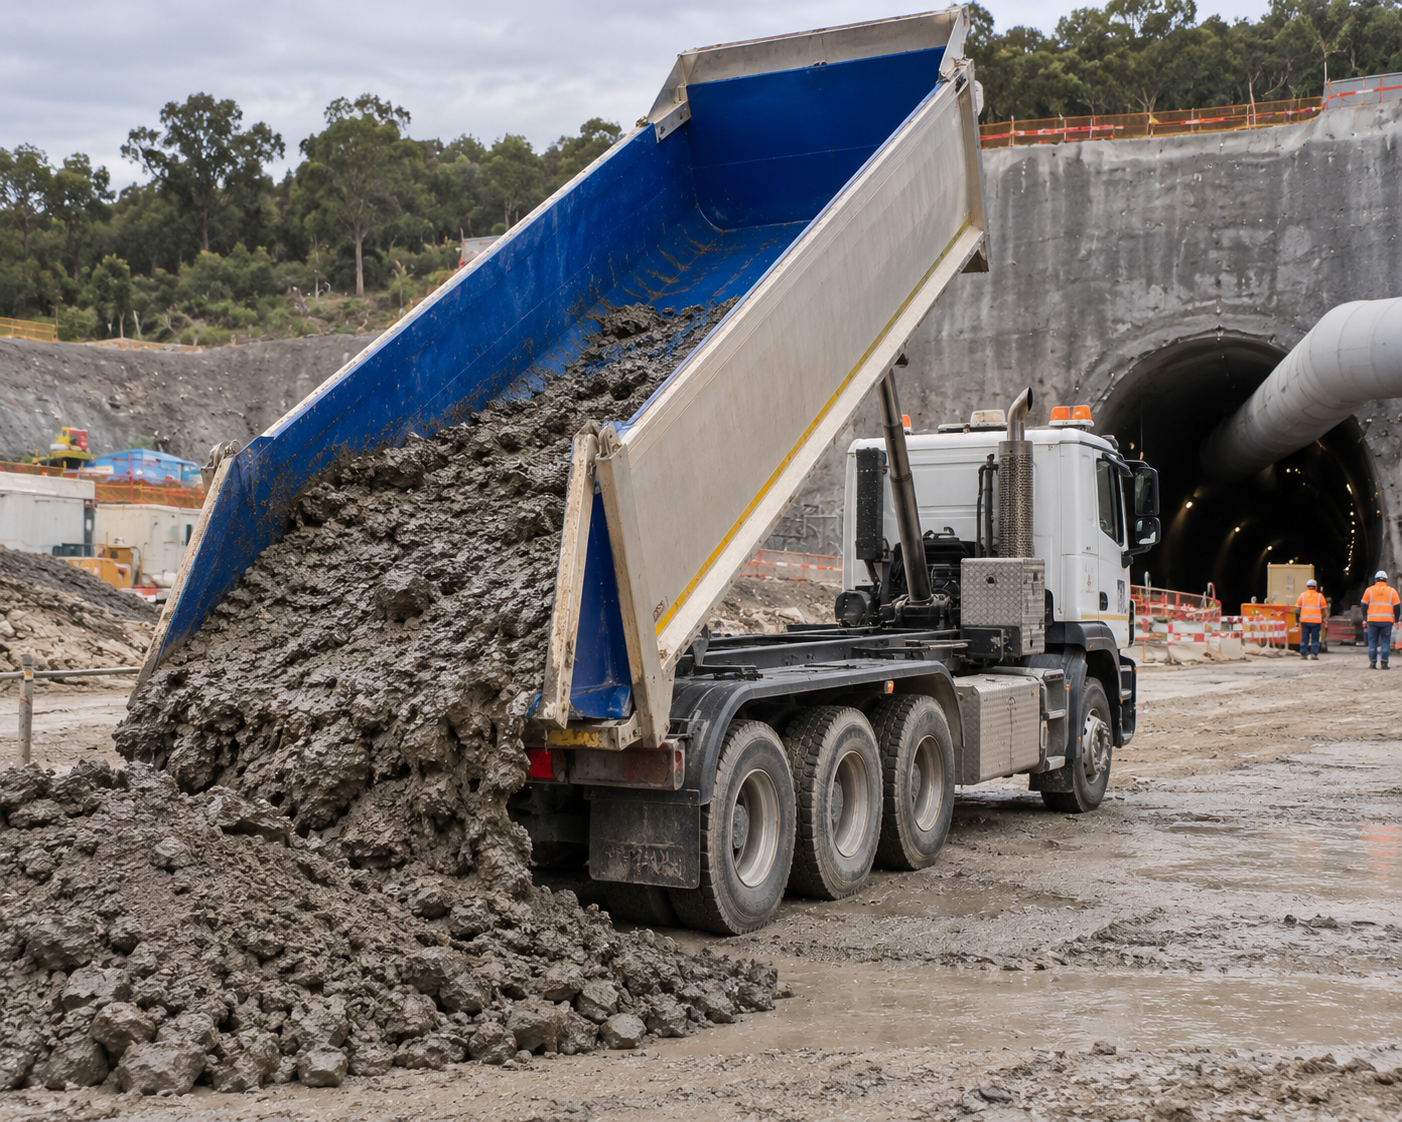
At a glance
- Use clear performance metrics to prove liner impact, rather than relying on general impressions from drivers or operators.
- Key indicators include cycle completion time, carryback, tipping angle, wear, repairs, downtime and payload efficiency.
- Lower carryback and faster discharge can improve turnaround, delivered payload and overall fleet productivity.
- OKUSLIDE® supports cleaner material release, safer tipping angles and reduced body wear, making liner value easier to measure through performance data.
Liners offer clear advantages: cleaner discharge, reduced carryback and less body wear. But for fleet operators, the real question is how much time and cost they actually save. Impressions from drivers or site staff are useful, but they are not proof.
That certainty comes from data. Tracking the right liner installation metrics before and after fitting gives you a measurable record of what changed and by how much. It turns a significant capital investment into a decision you can justify with numbers, not assumptions.
The sections below outline the key metrics to monitor before and after liner installation and how a UHMWPE liner like OKUSLIDE® delivers the expected operational gains.
How to Measure the Impact of Liner Installation: Key Metrics to Monitor Before and After
To measure liner impact properly, start with a clear operating baseline. Track the same materials, routes, trucks and discharge points before and after installation so the comparison reflects the liner’s effect, not a change in conditions.
The most useful metrics are the ones tied to output, safety, maintenance and cost. Tracking cycle time, carryback, tipping angle, downtime, maintenance spend and payload efficiency gives you a practical basis for assessing whether the liner is improving day-to-day performance.
Cycle Completion Time
Cycle completion time covers the full round trip: loading, hauling to the discharge point, tipping and returning for the next load. Record the average time across a representative sample of loads at your current setup to establish a baseline. Use consistent material types, routes and discharge points so the baseline reflects normal operating conditions.
After liner installation, time the same cycle again under comparable conditions. A shorter average cycle time usually indicates faster discharge, fewer interruptions at the tip site and quicker return to loading.
Even a 30-second reduction per cycle may not seem like much, but the same saving repeated across every truck, load and shift adds up to a significant gain in fleet throughput. This is why cycle time is one of the clearest indicators of liner performance.
Carryback and Material Retention
Carryback is the material left clinging to the body after tipping and returned to your operation site. It reduces delivered payload, adds cleaning time and can affect the next load if different materials are being carried.
To set your baseline, record carryback using a consistent visual rating system, retained-load estimates or weighing where practical. Also note where material builds up, such as the floor, corners, tailgate area or chute.
With the liner in place, run the same checks under the same conditions. A reduction in retained material shows whether the liner is improving release and reducing material build-up. Damp clay, for example, can leave a firm layer across the floor even after the main load has discharged. If that retained layer is smaller with the liner fitted, the difference shows up clearly in your measurements.
Tipping Angle
Tipping angle is a useful safety and performance metric because it shows how far the body must lift before the material starts moving and fully discharges.
At your current setup, record the approximate angle at which material begins to move and the angle needed for a complete unload. Sticky, wet or cohesive materials often require a higher angle, which raises the centre of gravity and increases instability risk, especially on uneven ground.
Once the liner is fitted, compare the angle required under the same conditions. If the material starts moving earlier and clears at a lower angle, the truck spends less time at full height. That means safer unloading conditions, less strain on the body during tipping and a clear, measurable sign of improved discharge behaviour.
Downtime and Maintenance Costs
Wear and maintenance trends usually need a longer tracking period than discharge metrics because they develop over repeated use. Using your current fleet data, record downtime hours, body or chute repairs, clean-out stoppages, replacement parts and maintenance labour costs linked to material hang-up, abrasion or impact damage.
Also track how downtime affects output. If a truck is unavailable for body repairs or repeated clean-out, record the missed loads, delayed deliveries or reduced shift output connected to that downtime.
After the liner has been running for a comparable period, compare the same figures. Fewer maintenance events, shorter stoppages, lower repair costs and more available truck hours indicate that the liner is reducing wear-related disruption. The cost saving goes beyond reduced repair spend — it includes the additional uptime, completed deliveries and shift output that would otherwise have been lost to stoppages.
Payload Efficiency
Without a liner, slow discharge and carryback can reduce actual shift output. Loads take longer to clear, and carryback reduces the weight that actually reaches the destination. The result is fewer completed runs and lighter effective deliveries across a shift.
Record loads completed and average delivered weight over a full shift to establish your reference point. This helps capture fleet performance instead of focusing on a single tip.
Run the same measurement post-installation and compare. Rising numbers point directly to liner performance. More loads in the same window point to faster turnaround, while more delivered tonnes per shift reflect cleaner, fuller discharge. Together, those gains show up as improved unloading efficiency across the fleet.
Keep in mind that a liner adds weight to the body. Efficiency gains come from quicker discharge and reduced carryback, not from a lighter tray.
Liner impact should be measured through practical fleet data, not general impressions. Tracking cycle time, carryback, tipping angle, downtime, maintenance cost and payload efficiency gives you a clear picture of whether the liner is delivering across discharge speed, safety, output and body protection.
OKUSLIDE® supports these improvements through cleaner material release, reduced carryback and abrasion-resistant body protection. Tracked across both sides of the installation, those benefits show up directly in the performance data you already collect.
If sticky or abrasive loads are slowing your unloading cycles, partner with a trusted liner supplier that offers liners matched to your fleet, material type and application. Talk to the OKUSLIDE® team today.
FAQs
Can liner performance vary depending on the material being hauled?
Yes, it can. Highly abrasive, sticky or wet materials interact differently with the liner surface, which can affect wear rate, discharge efficiency and carryback. As a result, the same liner may perform differently depending on the material and operating conditions.
What signs may indicate the liner needs inspection or adjustment?
Signs include increased carryback, slower or uneven material discharge, longer cycle times and more frequent material build-up. Visible wear patterns, thinning in high-impact areas and unexpected increases in maintenance are also key indicators that the liner is no longer performing as intended.
Do OKUSLIDE® liners deliver different benefits across different industries?
Yes. OKUSLIDE® liners can deliver different industry-specific benefits depending on the application. In mining, the key benefit is reduced wear and improved handling of highly abrasive materials. For construction fleets, the focus shifts to improved material flow and less downtime from blockages and body clean-outs.
Are OKUSLIDE® liners suitable for both wet and dry materials transport?
Yes. OKUSLIDE® liners are suitable for both wet and dry material transport. Their low-friction surface improves material flow in dry, abrasive conditions and supports cleaner discharge in wet or sticky materials by reducing carryback.